ELISA Kits
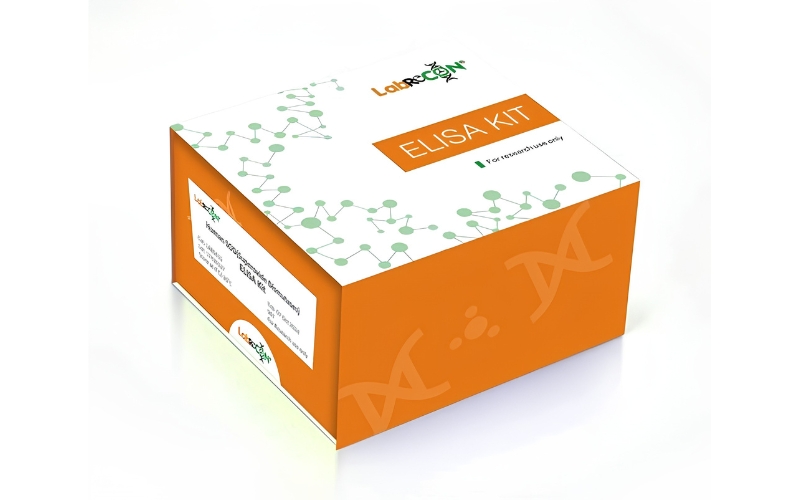
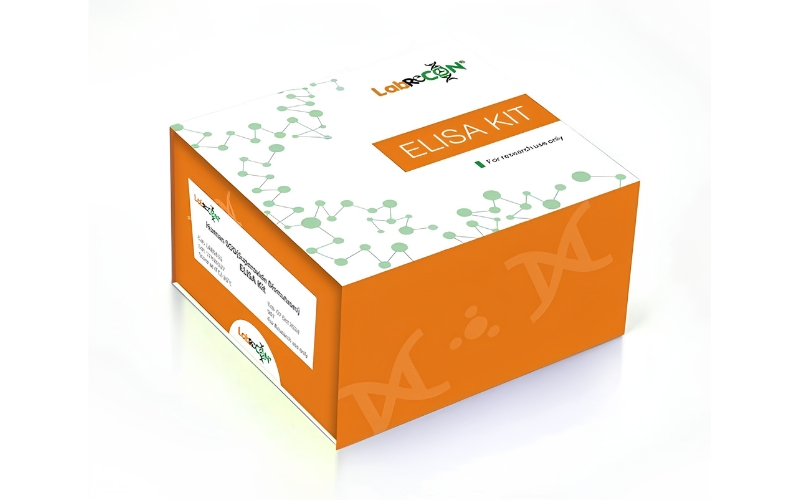
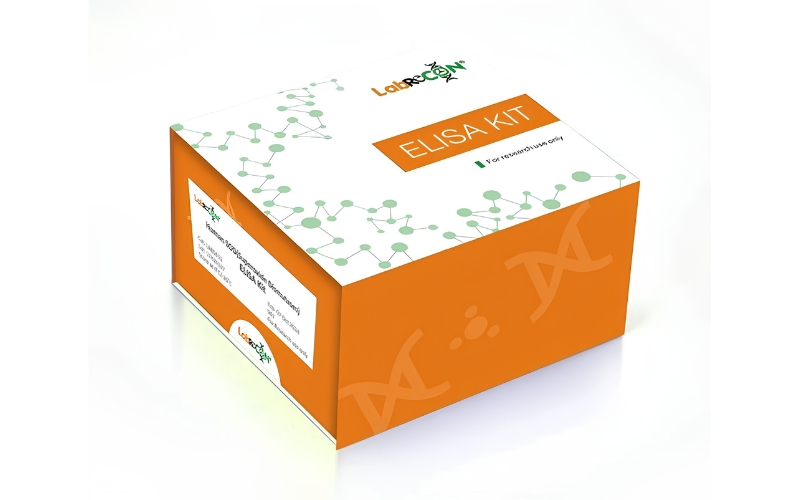
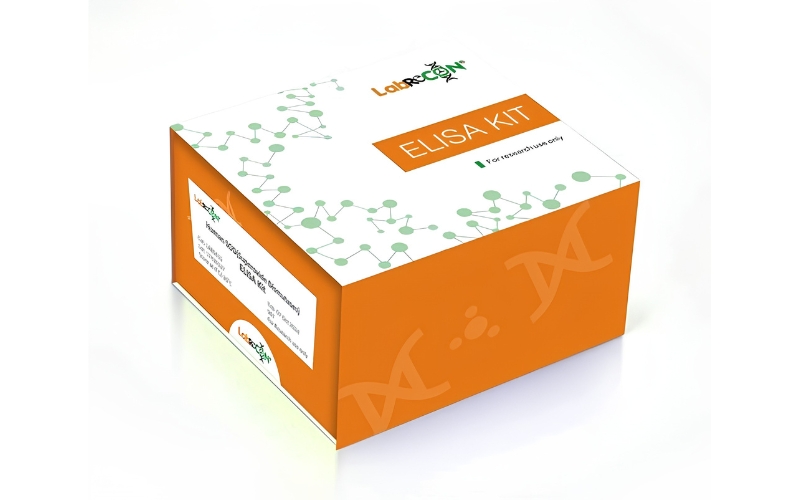
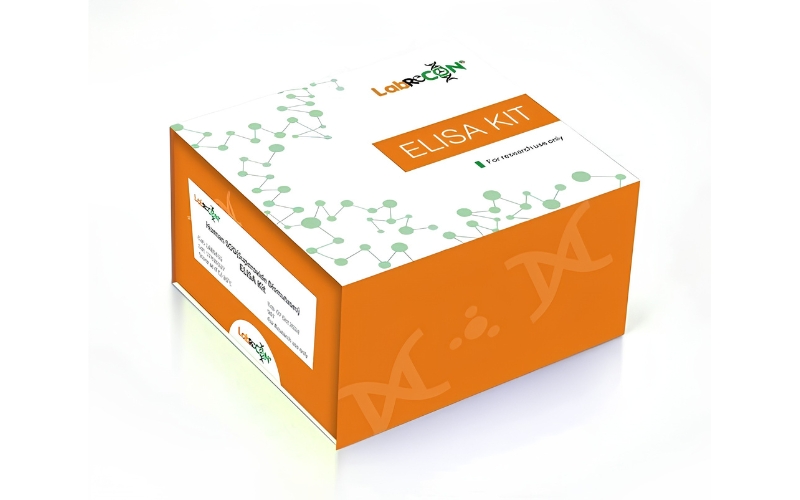
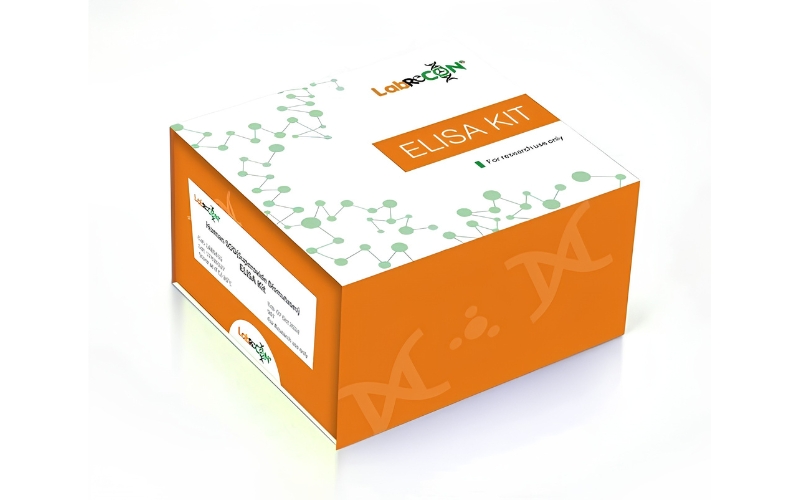
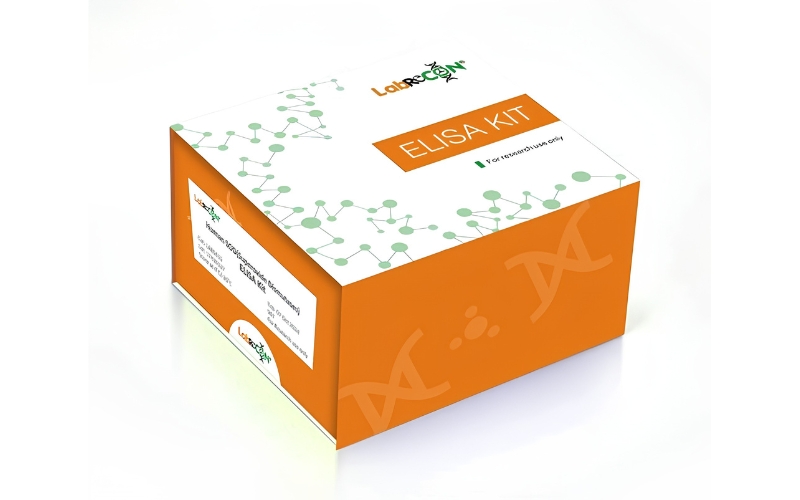
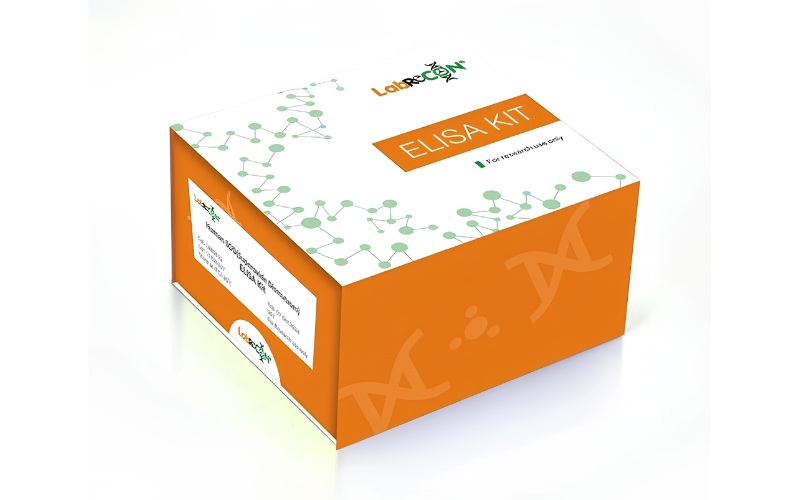
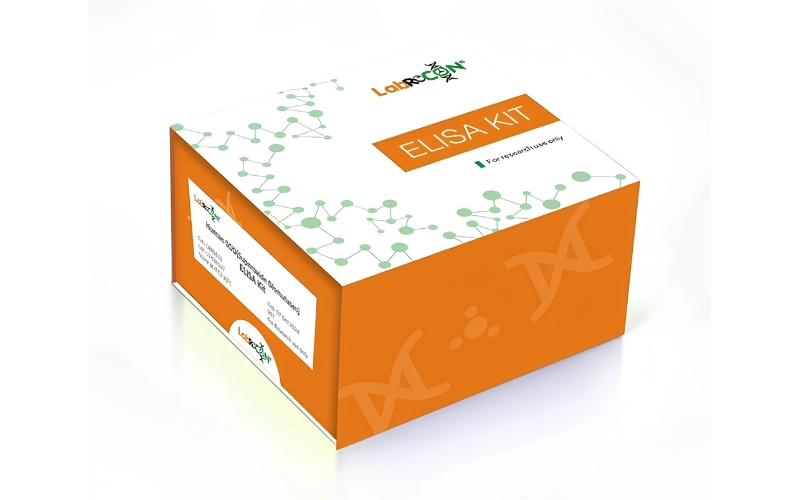
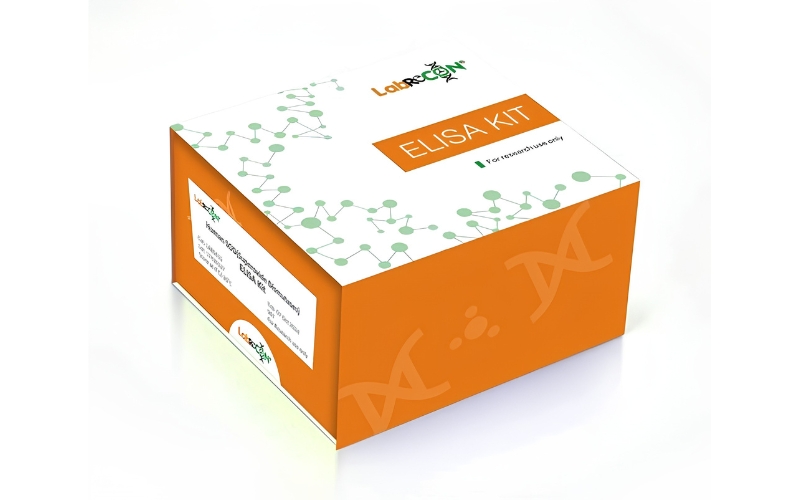
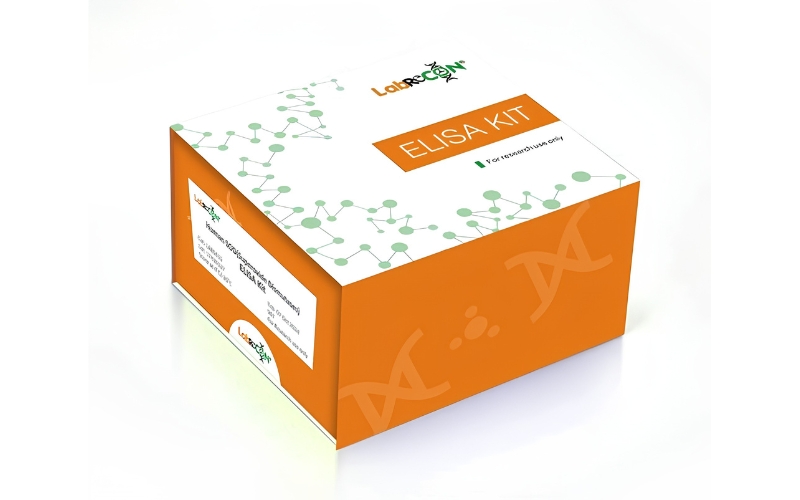
Lablisa® fT3(Free Triiodothyronine) ELISA Kit
Catalog No.: LAB13389
| Reactivity | Universal |
| Detection Range | 1.56-100 pg/mL |
| Sensitivity | 0.94 pg/mL |
Description
This ELISA kit uses the Competitive-ELISA principle. The micro-ELISA plate provided in this kit has been pre-coated with fT3. During the reaction, fT3 in the sample or standard competes with a fixed amount of fT3 on the solid phase supporter for sites on the Biotinylated Detection Ab specific to fT3. Excess conjugate and unbound sample or standard are washed away, and Avidin-Horseradish Peroxidase (HRP) conjugate are added to each micro plate well and incubated. Then a TMB substrate solution is added to each well. The enzyme-substrate reaction is terminated by the addition of stop solution and the color turns from blue to yellow. The optical density (OD) is measured spectrophotometrically at a wavelength of 450 nm. The concentration of fT3 in tested samples can be calculated by comparing the OD of the samples to the standard curve.
Technical Specifications
| Catalog Number | LAB13389 |
| Reactivity | Universal |
| Detection Range | 1.56-100 pg/mL |
| Sensitivity | 0.94 pg/mL |
Product Overview
Product name: | Lablisa® fT3(Free Triiodothyronine) ELISA Kit |
| Reactivity: | Universal |
| Alternative Names: | FT3 |
| Assay Type: | Competitive |
| Sensitivity: | 0.94 pg/mL |
| Standard: | 100 pg/mL |
| Range: | 1.56-100 pg/mL |
| Sample Type: | Serum, Plasma and Tissue homogenate and other biological samples;Sample volume:25μL |
| Assay Length: | 1.5H |
| Research Area: | Signal transduction; |
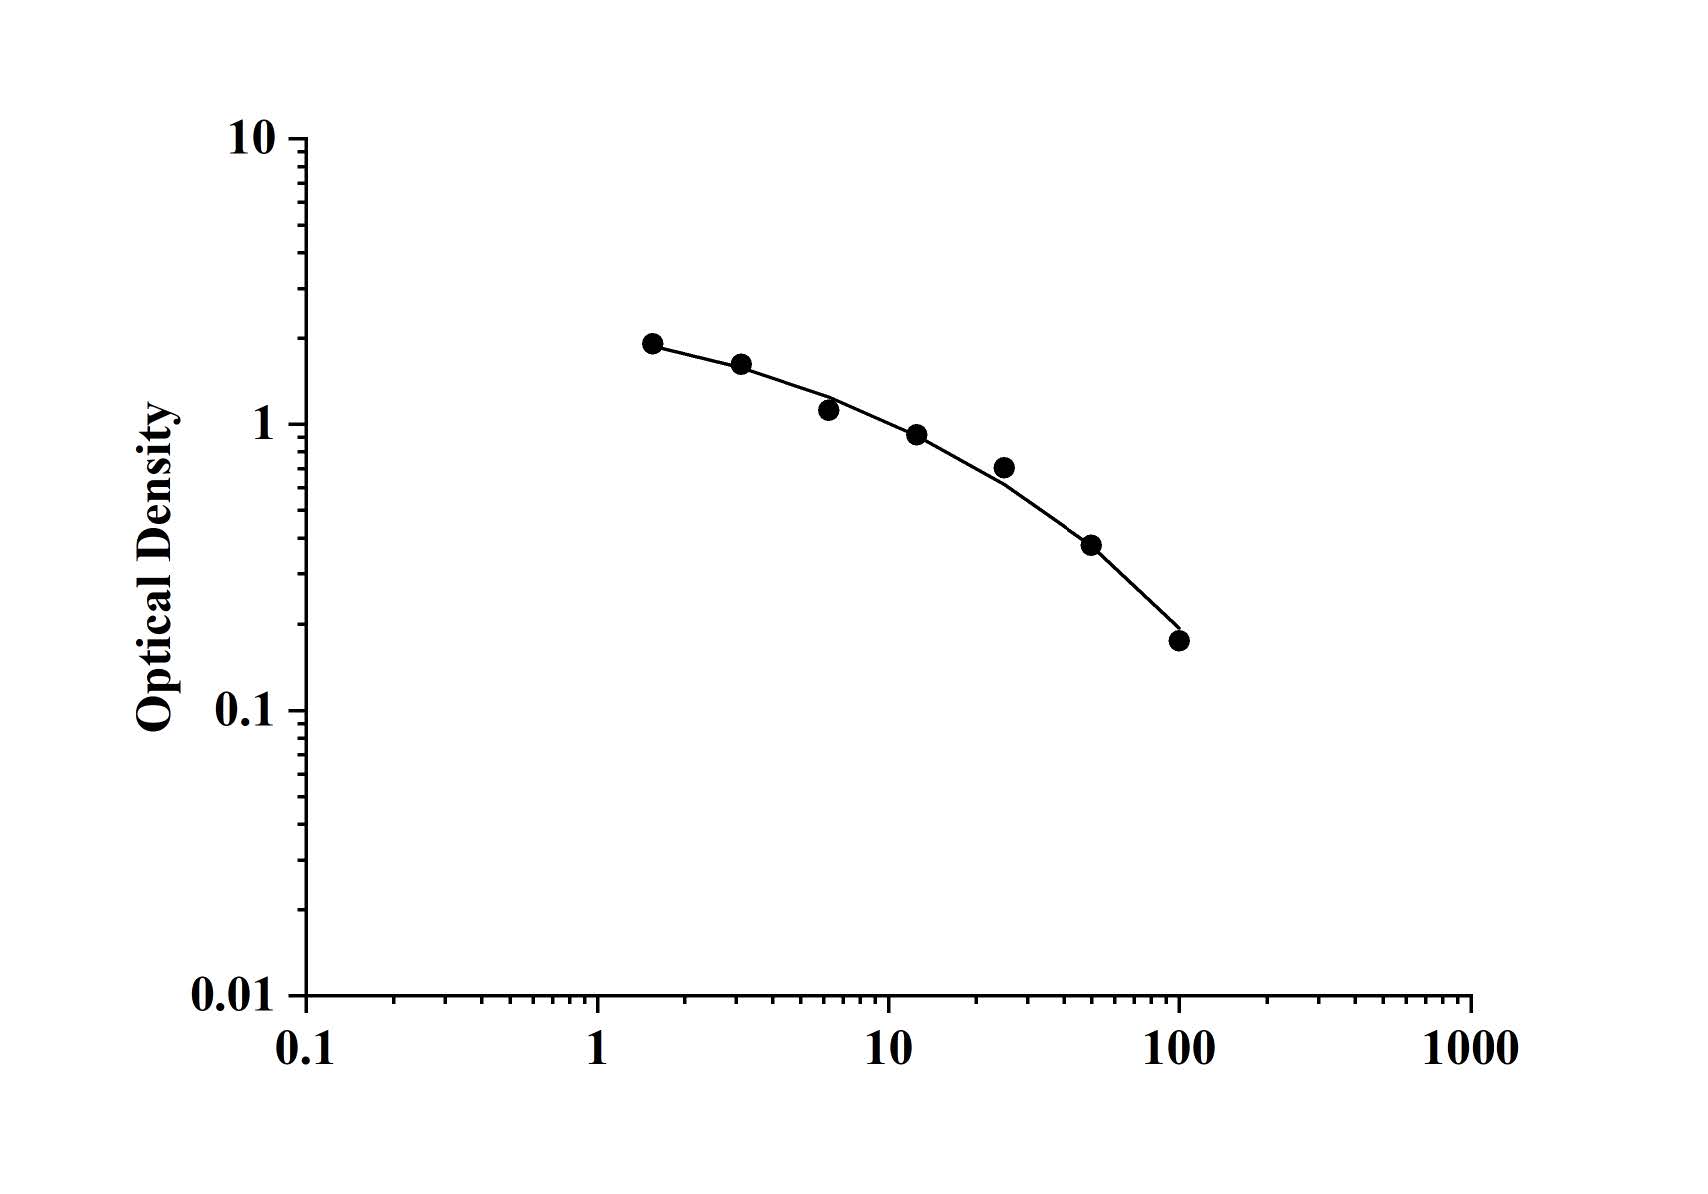
Standard curve

| Concentration (ng/mL) | OD |
|---|---|
| 100 | 0.201 |
| 50 | 0.375 |
| 25 | 0.614 |
| 12.5 | 0.933 |
| 6.25 | 1.208 |
| 3.13 | 1.681 |
| 1.56 | 1.882 |
| 0 | 2.456 |
Precision
Intra-assay Precision (Precision within an assay) :CV%<8% Three samples of known concentration were tested twenty times on one plate to assess intra-assay precision.
Inter-assay Precision (Precision between assays) :CV%<10% Three samples of known concentration were tested in forty separate assays to assess inter-assay precision.
Recovery
Matrices listed below were spiked with certain level of recombinant fT3 and the recovery rates were calculated by comparing the measured value to the expected amount of fT3 in samples.
| Matrix | Recovery range | Average |
|---|---|---|
| serum (n=8) | 94-103% | 98% |
| EDTA plasma (n=8) | 92-100% | 97% |
| Cell culture media (n=8) | 85-95% | 90% |
Linearity
The linearity of the kit was assayed by testing samples spiked with appropriate concentration of fT3 and their serial dilutions. The results were demonstrated by the percentage of calculated concentration to the expected.
| Matrix | 1:2 | 1:4 | 1:8 | 1:16 |
|---|---|---|---|---|
| serum (n=8) | 95-105% | 99-106% | 89-97% | 96-104% |
| EDTA plasma (n=8) | 87-97% | 91-101% | 91-99% | 91-99% |
| Cell culture media (n=8) | 99-107% | 90-99% | 90-97% | 89-98% |
Manuals on the web are for your reference only, specifications are subject to the delivery manuals.
Product Images
Protocol
For detailed protocol, assay guidance, and technical support, please contact our Customer Support team at
support@labrecon.in
support@labrecon.in
Publications
Avialable Soon...
Customer Reviews

Based on 0 reviews
Share your experience with this product to help other researchers.
Login to Submit a ReviewNo reviews yet. Be the first to share your experience!